
See How We Measure Impact: The Ripple Effect of Clean Water in Luuka
Beyond the Drop-Off
Short-term mission trips often face a major criticism: they focus heavily on the experience of the volunteer rather than the long-term, sustainable success of the community. At Impact Nations, we believe the Western Church is called to something greater. We don't just drop in and leave; we work exclusively with our local partners to bring lasting, generational change.
But how do we know it's working? We don't rely on guesswork. We track our beneficiary families for a full year to ensure our interventions—like our family water filters—permanently rescue lives.
Here is a definitive look at a recently completed 1-year tracking cycle for the Luuka Water Project in Uganda, and the incredible, data-backed transformation we witnessed.
The Core Pillars of Impact in Luuka, Uganda
To understand the true ripple effect of clean water, we track the multi-dimensional impact of the filters across health, community productivity, and total reach.
The "Institutional Multiplier" Effect
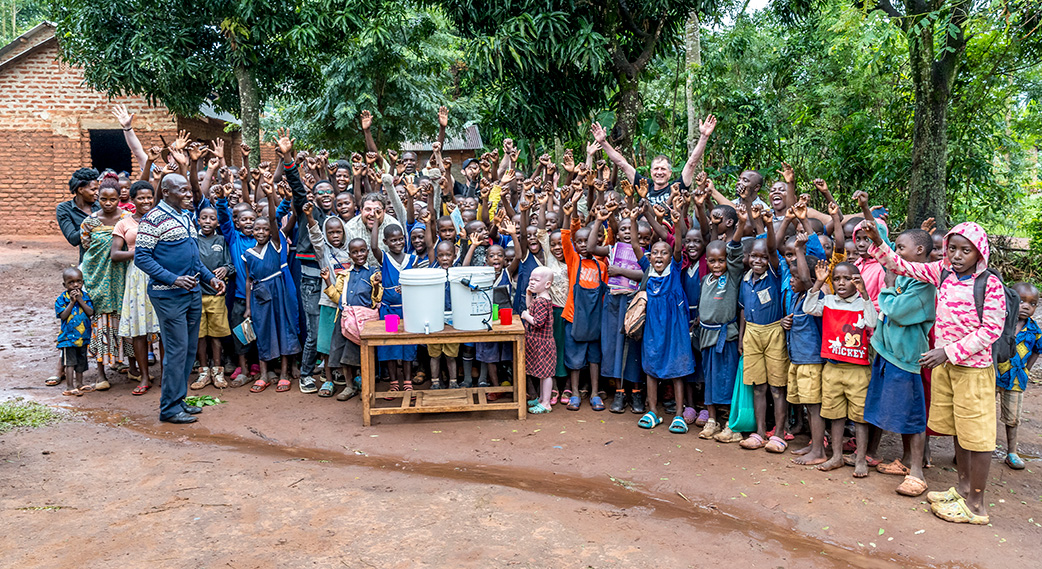
We strategically place filters in high-traffic zones to maximize the protective reach of the project. By utilizing 11 Community Hubs (like schools and clinics) alongside 159 Private Households, this single project is providing verified safe water to 3,850 beneficiaries.
Our Methodology: Proving the Data
This project tracks families longitudinally using ESRI Survey123 and barcode technology. Data is collected exclusively by our trusted Global Partners and Local Community Leaders to ensure high community adoption, authentic trust, and reporting accuracy.
The Control Metric: To guarantee the integrity of our impact data, we also track "Control Metrics"—non-waterborne seasonal issues like coughs, colds, and fevers. Even as waterborne illnesses dropped to near zero, seasonal illnesses remained steady (e.g., 40.8% at the 1-year mark). By tracking actual health events, we prove the sustained drop in diarrhea is directly tied to the clean water, rather than an overall lack of reporting.
The Human Element
Behind every data point is a restored life. Notes collected by our local partners capture the profound and sustained human relief a year after receiving the filters:
Join Us on the Frontlines
We measure impact because we believe the vulnerable deserve solutions that actually work. When you join a Journey of Compassion, you are stepping into a proven system of transformation.
Are you ready to be part of the impact? Join our next highly focused team and bring this kind of practical relief and supernatural power to the frontlines.